
Sobriety at Secret Planet Less is More
In the sixties and seventies, the adventure and discovery trip was a rare and precious time. It crowned a personal journey of discovery and learning built up in France or in nearby Europe.
At Secret Planet, we understand the meaning of this exceptional journey. Refusing to travel thousands of kilometers for a week of activity that could be done closer to home. A philosophy that has its origins in our trekking and adventure activities for over 30 years.
Over the last 15 years, we have accelerated our development in treks and expeditions, an offer that is inherently low in carbon emissions. Only our breathing disturbs the extraordinarily privileged environments through which we travel. Together with our clients, we strive to develop best practices in terms of our impact on biodiversity, water and waste.
No more short journeys that require flying, which offer only a truncated experience, too few opportunities for discovery and encounters. On the contrary, we emphase longer immersions, long treks, crossings or expeditions that give time to time.
Since 2022, we no longer offer trips lasting less than 14 days if we cannot find a means of transportation other than by plane (train, bus, etc.), with the exception of two or three expeditions that are part of a project in which several of our clients are involved over a long period of time.
In 2019, the average length of our trips requiring a flight was 18.7 days. In 2024, this average was 20.4 days, which is unprecedented in the world of travel.
To travel longer but less often has always been our creed. To offer less frequent experiences, no doubt, in view of the constraints of holidays and finances, but richer experiences, rich in encounters with traditional peoples, in discoveries of their traditions, in exploration of wild environments, in observation of biodiversity, in the search for oneself. Less is more.
Reduce our carbon emissions An urgent imperative
To understand what is at stake, it is necessary to have the natural carbon cycle in mind. An essential component of life, carbon is naturally present in the atmosphere, the hydrosphere (the water of rivers, oceans and glaciers) and the biosphere (living organisms). It is also present in the lithosphere, in the form of fossil resources (coal, gas, oil, etc.). In its natural state, carbon circulates between the biosphere, hydrosphere and atmosphere. The carbon in the lithosphere, on the other hand, is largely captive.
The industrialization of our economies has had two major consequences for the carbon cycle. The first is the extraction of carbon from the lithosphere and its release into the atmosphere. The second is unprecedented pressure on forest and wetland ecosystems and the release of carbon contained in the soil, trees and other living organisms into the atmosphere as well.
The scientific evidence is therefore clear: there is no carbon offset for the extraction of fossil resources. An ambitious forest regeneration policy would struggle to compensate for the damage caused by rampant deforestation.
Find the answers to all your questions here
Target of 37% reduction by 2030 vs. 2019 A commitment derived from the Paris climate agreements
With climate change and its consequences for the living now a reality, and with part of the population plunging into eco-anxiety in the face of political and economic systems that are struggling to make a real transition, we must act. Miracle technological solutions are not on the horizon, and remedies based on compensation are not satisfactory. So what can we do? Taking action to reduce our carbon emissions and following the trajectory of the Paris Agreement is still the most clear-cut objective today. It aims for carbon “neutrality” by 2050, requiring each player to begin reducing their carbon footprint by almost 5% annually. It is along this trajectory that we have set our objectives in 2022.
Our know-how, combined with the appeal of our niche trips, has given us an annual growth in activity of almost 25% per year between 2015 and 2019, taking us from a total carbon footprint of 1810 to 3430 tons of CO2e, of which more than 85% is linked to international flights. In 2022, we decided to change our growth model to meet our objectives.
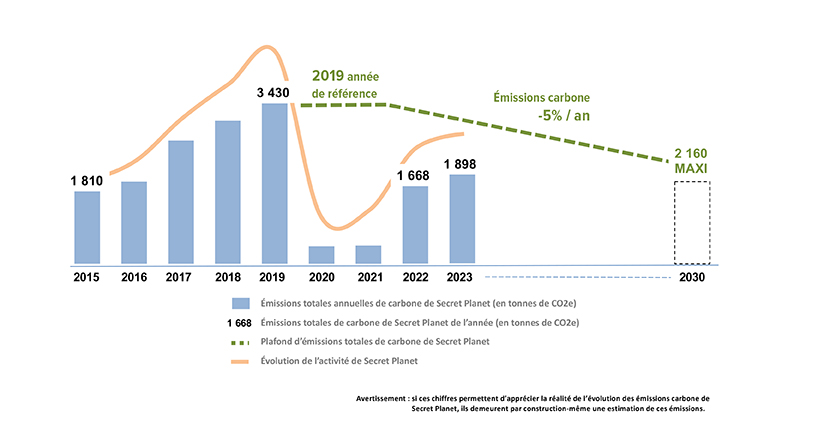
We have therefore committed to a carbon reduction in 2022, which we believe to be unprecedented in the tourism industry, aiming to reduce the total emissions of our activity by an average of 5% per year, taking 2019 as a reference year. Thus, in 2030, our objective is not to exceed 2160 tons of CO2e, i.e. a 37% reduction in our emissions compared to 2019.
Behind this commitment is a proactive objective of continuously realigning our offer towards ever more meaningful travel, with more added value, even longer trips for those that are only accessible by plane. Together with our customers, we favor more optimized flight plans, as air travel represents 83% of our emissions. More marginally, we are refining the details of our trips to make them more carbon-efficient (road and air transfers, accommodation), but the margin for improvement is generally very small, given the nature of our trips, with soft travel in general.
In this complex equation between air emissions, over which we have little control, and land emissions, over which we have little room for improvement, we try to find a middle ground with our customers. They play an essential role in accompanying us in this transformation, through their loyalty and their choices as discerning, responsible and respectful travelers.
Our 2024 carbon emissions progress report
Calculation of CO2 emissions Since 2018 on all our journeys
Since 2018, we have been calculating, as objectively as possible, the impact on global warming of each of our programs. We have defined an indicator in tons of CO2e (CO2 and greenhouse gas equivalent CO2) emitted that we have since published on each of our trips, in our technical sheets and on our websites, in order to raise awareness among our customers and internet users who visit our websites. Few in our industry have done this, but given the urgency of climate change, just raising awareness was no longer enough.
Development of two KPIs for managing our carbon emissions Carbon Intensity (CI) & Carbon Efficiency (CE)
We have implemented two KPIs internally to business model a more sustainable development for Secret Planet and to track our progress in this regard: Carbon Intensity (CI) & Carbon Efficiency (CE)
Our reasoning was inspired by finance and the famous ROCE (Return On Capital Employed) which is a traditional KPI of a company's performance: basically, what return (RO which corresponds to the Operating Result after tax) on the capital employed (which is the sum of fixed assets and working capital requirement).
In what interests us, it is therefore a question of calculating the economic return with regard to the carbon emissions, another ROCE which would correspond here to Return On Carbon Emissions...
1/ Carbon Intensity (CI)
We have taken the concept of Carbon Intensity (CI) which is defined as the "ratio of CO2e emissions to the production of the company" as being the "ratio of CO2e emissions to the turnover of the company". Basically, it answers the question "How much carbon do I need to emit to make €1 in revenue?". The less the company emits, of course, the better off the world is... As an example for Secret Planet in 2015, Secret Planet's Carbon Intensity was around 1, or 1 kg of CO2e emitted to generate €1 in turnover, or 1 ton of CO2e emitted to generate €1,000 in turnover. In 2019, our CI was 0.7 (therefore 700 g of CO2e emitted to generate €1 of turnover), much better therefore, and finally in 2021, our CI was 0.4 with the exceptional circumstances linked to the pandemic (refocusing on long significant expeditions with high added value, combined with a few short and local journeys...).

2/Carbon Efficiency (CE)
Above all, we have developed the concept of Carbon Efficiency (CE) as the ratio of CO2e emissions to the company's margin, whether it is a gross margin, an EBITDA, an EBIT or a Net profit. In our situation as a tour operator, we take the Gross Margin (GM) of our journeys as a key indicator. The CE is of course the indicator that interests us the most because it is the gross margin that our economic survival depends on. Basically, the CE answers the even more essential question, "How much carbon do I need to emit to make €1 in gross profit?" ". Here again, we have made good progress since Secret Planet's Carbon Efficiency was around 5 in 2015, i.e. 5 kg of CO2e emitted to generate €1 of gross margin, or 5 tonnes of CO2e emitted to generate 1 k€ of gross margin. In 2019, our EC was 3.2 (therefore 3.2 kg of CO2e emitted to generate €1 of gross margin), therefore a marked decrease and finally, in 2021, our EC was 1.7 for the exceptional reasons described above

3/ Relationships between CI, CE and GM%, and margin for improvement
The interest of these KPIs is strong because it allows us to model our development by integrating the issue of climate change.
In fact, the CE can be written as the ratio of the CI to the GM in percentage (GM%). So to decrease our CE, either we decrease our CI or we increase our GM%.
To reduce our CI, either we increase our turnover at constant emissions (more travel days, more added value, etc.), or we lower our emissions at iso turnover, it is work on the carbon footprint of each trip (direct flights, substitution of flights by less polluting transportation means, optimization of local transfers and accommodation, etc.).
To increase our GM%, it is mainly a question of focusing on the segments where we are the most efficient, where we have the most added value, the basis of any good strategy.

To date, we are not aware of any other company having implemented such a methodology, which we offer in "open source"*, for all players in the tourism industry and more broadly, for any economic organization, NGO, etc.
Carbon footprint calculation Flights account for 80 to 90% of the total

As part of our commitment to sustainable development, we calculate as objectively as possible the impact on global warming of each of our journeys. To do this, we take into account the international flight, domestic flights when they are planned, other transfers in private or collective vehicles, by train and finally, accommodation. And we complete the carbon footprint of all our trips with that of our agency based in Lyon, which we specify at the end of this web page.
Calculating the impact of international flights
We have chosen the carbon calculator from the GoodPlanet foundation, which is itself based on the Bilan Carbone® methodology developed by ADEME. Unsurprisingly, international flying accounts for the majority of our travel carbon footprint with an average per journey of 2.8 tonnes of CO2e in 2021. We have refined our calculations to take into account the actual routing our customers make, often with a stopover. Switching to direct flights represents an important source of reduction in the carbon emission of the flight, in the magnitude of 20 to 30%, but the price of the flight also increases. We now systematically offer it to our customers, but we do not yet impose it. Furthermore, we never take any flight without travel content linked to it. Finally, we also count in our carbon footprint the international flights taken by our customers for trips, generally expeditions, which are booked from us without the international flights.
Calculating the impact of domestic flights
We have chosen the Carbon Footprint® developed by ADEME and have browsed many websites to approach the calculation of the carbon footprint of local and regional flights when they are proposed in the program. We had to make proratas or to think by analogy when we couldn't find the exact route we were looking for. Depending on the type of aircraft, the duration of the journey, the geographical area, this approach gives us an average of 140 kg of CO2e per hour of flight and per passenger. Also, in our technical sheets, we multiply the durations of the local flights offered in the program by this value.
Calculating the impact of transfers by private vehicles
We have also used here the carbon footprint® developed by ADEME as well as some specialist or popularization websites to approach the calculation of the carbon footprint of transfers in the regions where we are going. We started with the unfavorable and fairly realistic assumption that we use on average old 4x4 vehicles and therefore more polluting, as well as more recent minibuses. We retained between 200 and 500 g of CO2e per kilometer and per vehicle. We have also retained the average assumption of 2 to 4 participants per vehicle, which is prudent, i.e. an amount of 106g of CO2e per kilometer and per passenger. We assumed that we were doing 50 to 70 kilometers per hour, which gives us an average of 7 kg of CO2e per vehicle hour and per passenger. Also, in our technical sheets, we multiply the durations of the local private transfers included in the program by this value. Given that our trips are mainly trekking and expeditions, the share of vehicles in the emissions of our trips remains relatively low.
Calculating the impact of other local transfers
To calculate the share of carbon emissions from other local transfers, we used the same reasoning and globally the same sources as for transfers in private vehicles. In summary, we have retained for our calculations 5 kg of CO2e per hour and per passenger for light vehicles (motorcycle, motorized canoe), 4 kg of CO2e per hour and per passenger for the train (much lower in France due to the energy mix of the country), approx. 2 kg of CO2e per hour and per passenger for line buses and other river boats, 300 kg of CO2e per hour and per passenger for a helicopter, closer to the Super Puma than to the Écureuil. Also, in our technical sheets, we multiply the durations of local transfers other than private included in the program by these values.
Calculating the impact of accommodation
To calculate the share of carbon emissions from accommodation, we again used the same reasoning and found new sources such as the Cornell Hotel Sustainability Benchmarking Index. Information is much harder to find. In our methodology, we have selected four types of accommodation: those with almost zero emissions (night in tents, homestays, etc.) which we have counted at zero, those with low emissions (campsite, guesthouse, Nepalese-type lodge, European refuge) that we counted at 10 kg of CO2e per night and per person, those with medium emissions (standard hotel or African-type lodge) that we counted at 16 kg of CO2e per night and per person and finally, those with high emissions (higher-end hotel or lodge, more upscale accommodation) that we counted at 25 kg of CO2e per night and per person. This approach includes building-related emissions but it is overall a more subjective than transportation and it requires making choices to simplify. A recent top-of-the-range hotel is sometimes more virtuous in terms of carbon footprint than an old mid-range hotel.
Summary and conclusions
In total, we find that the carbon footprint of our trips varies greatly, ranging from almost nothing (e.g. mountaineering training in the Alps) to 8.4 tonnes (e.g. expedition to the South Pole in Antarctica). For all of our programs, it is on average 2.8 tonnes per trip in 2021 with a preponderant share of international flights (87% of emissions on average), followed by the footprint of land transfers (8%), that of accommodation (3%) and finally that of local flights (2%).
We must remain humble in our calculation approach that is based on assumptions which, even if they are taken with the greatest rigor and sincerity possible, remain very simplified and are therefore by nature subjective. Our goal is not to calculate our carbon footprint per trip to the nearest kilo of CO2e. It is a fortiori the same for our total footprint which is the sum of the carbon footprint of all the clients that have traveled with Secret Planet over a given year. For example, we had to make approximations for 2015, 2016 or 2017 with programs that no longer always exist exactly as they were proposed.
But the order of magnitude is there and the acceptable margin of error to allow us to make a diagnosis and set ourselves objectives. Moreover, it is the evolution of our carbon footprint that interests us, so the challenge is not so much the precision of the calculation of each trip but the measurement of the evolution of the total from one year to the next. By maintaining the same assumptions over the analysis period, we ensure the relevance of the comparison.
Your voluntary carbon contribution A donation to the planet
Despite our relative and absolute reduction efforts, carbon emissions remain and represent the only impact on the environment over which you have no control. However, there are other areas in which you can act in the course of your journey, such as biodiversity, waste management (plastics, electronics, etc.), and the respect of the populations you meet.
It is thus at the request of participants passionate about our nature journeys that we have developed this possibility of voluntary carbon contribution.
Estimating the "value" of a ton of carbon is probably the most delicate part, because by nature arbitrary, even political!... And above all, extremely theoretical. The price per ton of carbon is a tool that makes it possible to integrate into the market prices of goods and services the invisible costs of the damage caused by greenhouse gas emissions. Currently estimated at between €20 and €30, a tonne of carbon should increase in the years to come to reach €200 or even €300 by 2030 or 2040.
We had decided to set the reference price per tonne of carbon at €30 for 2019, with the intention of increasing it by €10 per year over the following years... The pandemic stopped this increase for 2 years . We will move it on January 1, 2023 to €60, closer to its estimated current levels.
This contribution is the product of the “carbon footprint of your journey formulated in tonnes” and the “theoretical price retained by Secret Planet for a ton of carbon in 2019”, i.e. an average of 1.5 ton multiplied by €30, namely €45 for our journeys.
Then, we encourage you to support with a donation two NGOs committed to the environment that we have selected, recognized for their actions in terms of reforestation and other sustainable development projects. These donations are made on a voluntary basis. These NGOs being of General Interest, they offer you the opportunity for French tax payers of a reduction in income tax of 66% of the donation made: thus, 33 € of donations correspond to 100 € of donation, thus facilitating your commitment. Check in your own country what are the tax deduction rules for this type of actions.
To date, since 2019, we have been able to collect nearly €7,000, all of which has been donated to these two associations.
Two complementary NGOs GoodPlanet & Oceans Without Plastics
We have selected two NGOs that share the commitments made in our charter. We propose, by your donations to them, that you share our commitment towards the planet and our desire to develop responses to today’s environmental challenges. These NGOs offer complementary approaches in terms of development of education, the fight against poverty, global warming, and plastics pollution.


The office's carbon footprint Less than 1% of total Secret Planet
We only have one office based in Vieux Lyon in France. The main carbon emissions that we have identified are as follows:
- energy consumption ;
- use of digital: emails, internet browsing, video playback, cloud hosting;
- team scouting trips;
- transportation to the offices for nomads, that is to say those of our colleagues who work from home and who come regularly to our offices in Lyon;
- purchase of equipment, notably IT, and purchase of supplies.
Excluding the digital carbon footprint, which we do not know precisely today and which we will be working on in the coming months, the agency's carbon footprint was around 15 tonnes CO2e in 2019, a figure that is down with the covid in 2020 and 2021. It therefore represents nearly 4 per thousand of the carbon footprint generated by all the journeys we organize.
Excluding digital, the team's reconnaissance trips and the transportation, sometimes in private vehicles, of the nomads represent the largest part of this total. The solutions go through the train, carpooling and more sobriety.